JVM 🤖
Java
Difference between JDK, JRE, and JVM
Java is a high-level, class-based, object-oriented programming language that is designed to have as few implementation dependencies as possible. It is a general-purpose programming language intended to let programmers write once, run anywhere (WORA), meaning that compiled Java code can run on all platforms that support Java without the need to recompile
JDK
Java Development Kit is a free Java application development kit distributed by Oracle Corporation,
including the Java compiler (javac), standard Java class libraries, examples, documentation, various
utilities and the Java runtime system (JRE)
JRE
Java Runtime Environment - minimal (without compiler and other tools development) implementation of the virtual machine required for execution of Java applications. Consists of virtual Java Virtual Machine and Java class libraries. The JRE is freely available for most platforms can be downloaded from the Oracle website. The development tools, along with the JRE, are included in the JDK
JVM
Java Virtual Machine the main part of the Java runtime system, the so-called Java Runtime Environment (JRE). The Java
Virtual Machine executes Java bytecode that is pre-generated from the source text of a Java program by the Java
compiler (javac). The JVM can also be used to run programs written in other programming languages. For example, Ada
source code can be compiled into Java bytecode, which can then be executed by the JVM. The JVM is a key component of the
Java platform. Because Java virtual machines are available for many hardware and software platforms, Java can be
considered both middleware and a platform in its own right. Using a single bytecode across multiple platforms allows
Java to be described as “compile once, run everywhere”
Java virtual machines typically include a bytecode interpreter, but many machines also use JIT compilation of frequently executed bytecode fragments into machine code to improve performance
Programs intended to run on the JVM must be compiled in a standardized portable binary format, which is typically
represented as .class files. A program can consist of many classes located in different files. To make it easier to
host large programs, some .class files can be packaged together in what is called a .jar file (short for Java
Archive).
The JVM virtual machine executes .class and .jar files, emulating the instructions given in them in the following
ways:
- Interpretation
- Using a JIT compiler

Java Bytecode
Java bytecode is a set of instructions executed by the Java virtual machine. In most cases, Java bytecode is generated
for execution on the Java virtual machine from Java source code. The only original compiler that converts Java code into
Java bytecode is Javac, created by Sun Microsystems
Javac
Javac is an optimizing compiler for the Java language, included in many Java Development Kits (JDKs). The compiler
accepts source code that conforms to the Java language specification (JLS) and returns bytecode that conforms to the
Java Virtual Machine Specification (JVMS). Javac is written in Java. Can be called directly from java programs (JSR 199)
The execution of Javac is divided into the following phases:
- All the source files specified on the command line are read, parsed into syntax trees, and then all externally visible definitions are entered into the compiler's symbol tables
- All appropriate annotation processors are called. If any annotation processors generate any new source or class files, the compilation is restarted, until no new files are created
- Finally, the syntax trees created by the parser are analyzed and translated into class files. During the course of the analysis, references to additional classes may be found. The compiler will check the source and class path for these classes; if they are found on the source path, those files will be compiled as well, although they will not be subject to annotation processing

JVM
JVM (Java Virtual Machine) Architecture
The Java Virtual Machine consists of three separate components:
- Class Loaders
- Memory Areas
- Execution Mechanism

Class Loaders
How ClassLoader Works in Java?
Class loader is used to supply the JVM with compiled bytecode, which is typically stored in files with the .class
extension, but can also be obtained from other sources, for example, downloaded over the network or generated by the
application itself
Java implements lazy (or lazy) loading of classes. This means that the loading of classes of reference fields of the loaded class will not be performed until an explicit reference to them is encountered in the application. In other words, resolving symbolic links is optional and does not occur by default. However, the JVM implementation can also use energetic loading of classes, i.e. all symbolic links must be taken into account immediately
There are three standard loaders in Java, each of which loads a class from a specific location:
Bootstrapis a basic loader, also called Primordial ClassLoader. loads standard JDK classes from thert.jararchiveExtensionClassLoader – extension loader. loads extension classes, which are located in thejre/lib/extdirectory by default, but can be set by thejava.ext.dirssystem propertyApplication / SystemClassLoader – system loader. loads the application classes defined in theCLASSPATHenvironment variable
If the desired class has not been loaded before, according to the principle of delegation, control is transferred to the
parent loader, which is located one level higher in the hierarchy. The parent loader also tries to find the desired
class in its cache. If a class has already been loaded and the loader knows its location, then the Class object of that
class will be returned. If not, the search will continue until it reaches the base Bootstrap. If the base loader does
not have information about the required class (i.e. it has not yet been loaded), the bytecode of this class will be
searched according to the location of classes that the loader knows about, and if the class cannot be loaded, control
will return back to the downloader, which will try to download from sources known to it. As mentioned above, the
location of classes for the Bootstrap loader is the rt.jar library, for the Extension loader - the directory
with extensions - jre/lib/ext, for the Application / System one - CLASSPATH, for the user one it can be something
different
The class loader subsystem is responsible for more than just searching and importing binary class data. It also checks the validity of imported classes, allocates and initializes memory for class variables, and helps resolve symbolic links. These steps are performed in the following order:
-
Loading — searching and importing binary data for a type by its name, creating a class or interface from this binary representation
-
Linking — performing verification, preparation and optional permission:
- Verification — checking the correctness of the imported type
- Preparation — allocating memory for static class variables and initializing memory to default values
- Resolution — converting symbolic link types into direct links
-
Initialization — calling to Java code that initializes class variables to their correct initial values
The standard way to load a class with a loader different from the current one is a special version of the static
Class.forName method:
public static Class forName(String name, boolean initialize, ClassLoader loader);
If the initialize value is true, then initialization occurs immediately, otherwise it is delayed until the first call to
any constructor, static method or field of this class
By using separate ClassLoader you can also load the same class from multiple sources, and they will be treated as different classes in JVM. J2EE uses multiple class loaders to load a class from a different location like classes from the WAR file will be loaded by Web-app ClassLoader while classes bundled in EJB-JAR are loaded by another classloader
Classpath
It specifies a list of directories, JAR files, and ZIP files where the JVM should look to find and load class files
In addition to Java applications directly (java command), this parameter is also applicable to other JDK utilities, such as javac, javadoc and others
There are two main ways to set classpath: in the OS environment variable CLASSPATH, and in the command line argument
-cp (synonymous with -classpath). The second method is preferable because it allows you to set different values for
different applications. Default value is the current directory
The parameter passes the paths to jar files and root directories with packages. Paths are separated by the symbol : in
the command line parameter, or ; in the environment variable. To include all files in a directory, you can use the *
symbol at the end of the path
If the application is launched from a jar file (java -jar), the classpath must be specified in its manifest. Inside the archive, a line like Main-Class is added to the META-INF/MANIFEST.MF file: com.studies.MyClass
Memory areas
- The class area is designed to store data from .class files: for example, metadata, field and method data, and method code. Class area is created automatically when the virtual machine starts, and there is only one class area per VM
- Heap. The heap stores all objects and their corresponding instance variables. When we create a new instance of a class, it is immediately loaded into the heap area, which remains singular while the task is running.
- Stack. All local variables, method calls and partial results are loaded into it
- PC register. The PC register stores the addresses of the Java virtual machines currently performing the operation. In Java, each thread gets its own PC register
- Native methods stack. Native methods are methods written in C or C++. The JVM stores stacks that support such methods, with a separate native method stack dedicated to each thread.
- JNI (Java Native Interface)
is a framework that allows Java code to call or be called by native applications and libraries
written in languages like C and C++. How JNI works:
- Java code declares a native method
- C/C++ implements that method using JNI headers
- Java loads the native shared library (
.so,.dll,.dylib) usingSystem.loadLibrary - Native code runs and can even call Java methods via JNI
Garbage Collection
Generational Garbage Collection
An object is considered garbage and its memory can be reused by the VM when it can no longer be reached from any reference of any other live object in the running program. Efficient collection is made possible by focusing on the fact that a majority of objects "die young."
Generations
To optimize for this scenario, memory is managed in generations (memory pools holding objects of different ages). Garbage collection occurs in each generation when the generation fills up.
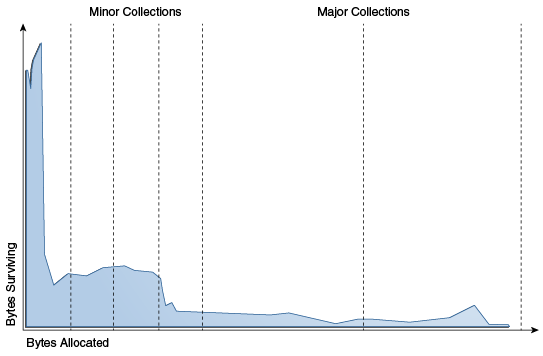
The vast majority of objects are allocated in a pool dedicated to young objects (the young generation), and most objects die there. When the young generation fills up, it causes a minor collection in which only the young generation is collected; garbage in other generations isn't reclaimed. The costs of such collections are, to the first order, proportional to the number of live objects being collected; a young generation full of dead objects is collected very quickly. Typically, some fraction of the surviving objects from the young generation are moved to the old generation during each minor collection. Eventually, the old generation fills up and must be collected, resulting in a major collection, in which the entire heap is collected. Major collections usually last much longer than minor collections because a significantly larger number of objects are involved.
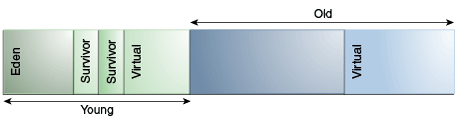
The young generation consists of eden and two survivor spaces. Most objects are initially allocated in eden. One survivor space is empty at any time, and serves as the destination of live objects in eden and the other survivor space during garbage collection; after garbage collection, eden and the source survivor space are empty. In the next garbage collection, the purpose of the two survivor spaces are exchanged. The one space recently filled is a source of live objects that are copied into the other survivor space. Objects are copied between survivor spaces in this way until they've been copied a certain number of times or there isn't enough space left there. These objects are copied into the old region. This process is also called aging.
There is no one right way to choose the size of a generation. The best choice is determined by the way the application uses memory as well as user requirements. Thus the virtual machine's choice of a garbage collector isn't always optimal and may be overridden with command-line options.
Collectors
Serial Collector
The serial collector uses a single thread to perform all garbage collection work, which makes it relatively efficient because there is no communication overhead between threads.
It's best-suited to single processor machines because it can't take advantage of multiprocessor
hardware, although it can be useful on multiprocessors for applications with small data sets (up to
approximately 100 MB). The serial collector is selected by default on certain hardware and operating
system configurations, or can be explicitly enabled with the option -XX:+UseSerialGC.
Parallel Collector
The parallel collector is also known as throughput collector, it's a generational collector similar to the serial collector. The primary difference between the serial and parallel collectors is that the parallel collector has multiple threads that are used to speed up garbage collection.
The parallel collector is intended for applications with medium-sized to large-sized data sets that
are run on multiprocessor or multithreaded hardware. You can enable it by using the -XX: +UseParallelGC option.
Parallel compaction is a feature that enables the parallel collector to perform major collections in
parallel. Without parallel compaction, major collections are performed using a single thread, which
can significantly limit scalability. Parallel compaction is enabled by default if the option -XX: +UseParallelGC has been specified. You can disable it by using the -XX:-UseParallelOldGC option.
Garbage-First (G1) Collector
G1 is a mostly concurrent collector. Mostly concurrent collectors perform some expensive work concurrently to the application. This collector is designed to scale from small machines to large multiprocessor machines with a large amount of memory. It provides the capability to meet a pause-time goal with high probability, while achieving high throughput.
G1 is selected by default on most hardware and operating system configurations, or can be explicitly
enabled using -XX:+UseG1GC.
The Z Garbage Collector
The Z Garbage Collector (ZGC) is a scalable low latency garbage collector. ZGC performs all expensive work concurrently, without stopping the execution of application threads.
ZGC provides max pause times of a few milliseconds, but at the cost of some throughput. It is
intended for applications, which require low latency. Pause times are independent of heap size that
is being used. ZGC supports heap sizes from 8MB to 16TB. To enable this, use the -XX:+UseZGC option.
Selecting a collector
Unless your application has rather strict pause-time requirements, first run your application and allow the VM to select a collector.
If necessary, adjust the heap size to improve performance. If the performance still doesn't meet your goals, then use the following guidelines as a starting point for selecting a collector:
- If the application has a small data set (up to approximately 100 MB), then select the serial
collector with the option
-XX:+UseSerialGC. - If the application will be run on a single processor and there are no pause-time requirements,
then select the serial collector with the option
-XX:+UseSerialGC. - If (a) peak application performance is the first priority and (b) there are no pause-time
requirements or pauses of one second or longer are acceptable, then let the VM select the
collector or select the parallel collector with
-XX:+UseParallelGC. - If response time is more important than overall throughput and garbage collection pauses must be
kept shorter, then select the mostly concurrent collector with
-XX:+UseG1GC. - If response time is a high priority, then select a fully concurrent collector with
-XX:UseZGC.
These guidelines provide only a starting point for selecting a collector because performance is dependent on the size of the heap, the amount of live data maintained by the application, and the number and speed of available processors.
If the recommended collector doesn't achieve the desired performance, then first attempt to adjust the heap and generation sizes to meet the desired goals. If performance is still inadequate, then try a different collector: Use the concurrent collector to reduce pause-time, and use the parallel collector to increase overall throughput on multiprocessor hardware.
Java Stack Machine
A stack machine is a type of CPU or virtual machine architecture where operations are performed using a stack (Last-In-First-Out structure), rather than using registers (like in x86 or ARM).
Instead of doing: R1 = R2 + R3
You push values onto a stack and then call add, like
push R2
push R3
add
The add in this case pops the operands and then pushes the result.
Execution Mechanism
Interpretation is the process of reading and executing the source code. It is implemented by a program - an interpreter. This type of software is used for testing hardware and software. However, it does not store any information about the product being tested
Its parts are:
- Interpreter
- JIT compiler
- Garbage collector
Before executing the program, the interpreter and JIT (Just-in-time) compiler convert the bytecode into machine instructions. The interpreter does this line by line
At that moment, when a script detects repeating code, a JIT compiler is connected to it to speed up the operation. It then compiles the bytecode and replaces it with its own bytecode. This process improves the performance of the entire system.
But what is the responsibility of the garbage collector in this case? In some other programming languages (such as C++), freeing memory from objects without circular references depends only on the programmer himself. However, in the JVM, this is done by the garbage collector, which optimizes memory usage
It is important to note that garbage collection is performed automatically in the JVM after certain periods of time and
does not require special attention from specialists. Of course, you can try to force this process by calling
System.gc(), but there is no guarantee that this will work
JVM analytics
There are multiple tools that can be used to get the information about the JVM.
jconsolevisualvmjcmdasync-profiler- intellij profiler
Dumps
| Type | What It Is |
|---|---|
| Heap Dump | Snapshot of the JVM heap memory — shows all objects, classes, references |
| Thread Dump | Snapshot of all JVM threads and their states — stack traces, locks, etc. |
Heap Dump
We better look for high-retaining classes or unexpected singletons holding onto references. With a head dump it's possible to
- see class-wise object counts & sizes
- sort by shallow/deep size
- follow object references
- detect memory leaks (large object graphs not GC’d)
- check suspicious collections presence (e.g., a List with 1M entries)
Thread Dump
Thread dumps might help us find
- blocked threads (deadlocks)
- runnable threads doing CPU-intensive work
- waiting threads stuck on locks or conditions
Example of a deadlock in a thread dump
"Thread-1" BLOCKED on object monitor ...
  - waiting to lock <0x1234> held by "Thread-2"
"Thread-2" BLOCKED ...
  - waiting to lock <0x5678> held by "Thread-1"
Flame Graph
A flame graph is a visualization of stack traces sampled over time, it shows
- which methods are consuming the most time
- call paths that led to those methods
- a hierarchical view of what our app is doing
Each box is a method
- width = how much time was spent there (or how often it was sampled)
- stacked vertically = call depth
- the tallest flames = deepest call stacks
- the widest flames = performance hot spots
Thing to look out for
- flat wide boxes → many calls to shallow methods
- deep tall stacks → deep recursion or call chains
- repeated patterns → loops or frequently called services
- native calls → expensive JNI or I/O